Google Analytics is one of the most powerful tools available. The fact that it’s free certainly helps.
Analytics help you track patterns and user behaviour. It’s a very sophisticated suite of software and many businesses have full-time analytics teams capturing, analysing and sharing the data.
For most people there’s too much information in there to be usable. I’ve seen plenty of business owners and marketers disappear down the rabbit hole trying to prove or disprove a hypothesis and walking away none the wiser.
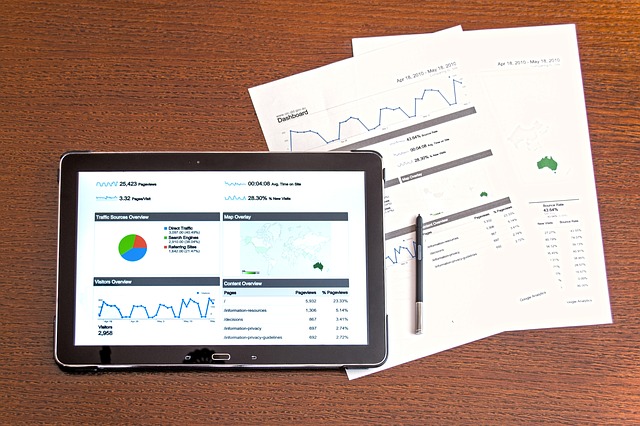
Thank goodness for dashboards.

GA has a drag and drop dashboard interface where you can construct a canvas of key metrics.
I have a number of dashboards I deploy and modify depending on what type of site I am working on and the business focus at the time.
Here’s 5 covering a range of use cases:
Click on the link and your GA account will open. Choose the profile you want to apply it to.
Find out your best performing social media channels and the metrics behind each one.
Shows Average order value, revenue, transactions, best referring channels and more. Requires Conversions > Ecommerce to be setup
Spending on Google Adwords? You probably need this.
Displays best performing keywords, trends and gaps.
Understand best referring channels, conversion rate and location. Requires Goal conversion to be setup